Example brain view of neuralib.atlas.ibl
basic plotting wrapper from
iblatlasSee source doc in
iblatlas.plots.plot_scalar_on_slice
[1]:
import numpy as np
from iblatlas.plots import prepare_lr_data
from matplotlib import pyplot as plt
from neuralib.atlas.ibl.plot import IBLAtlasPlotWrapper
[2]:
%load_ext autoreload
%autoreload
[3]:
ibl = IBLAtlasPlotWrapper()
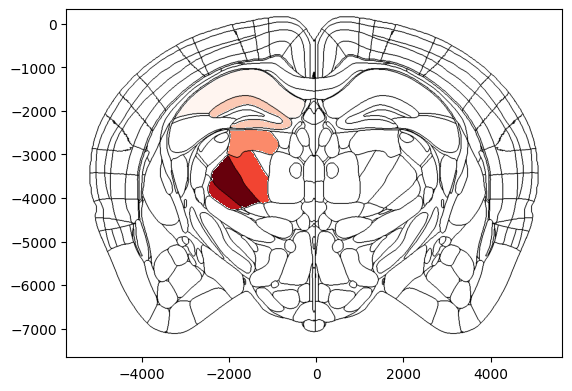
Example of plot the allen map with given areas
[4]:
acronyms = np.array(['VPM', 'VPL', 'PO', 'LP', 'CA1', 'DG-mo'])
ibl.plot_scalar_on_slice(acronyms, coord=-2000, plane='coronal', background='boundary', cmap='Reds')
plt.show()
Plot region: ['CA1', 'DG-mo', 'LP', 'PO', 'VPL', 'VPM']
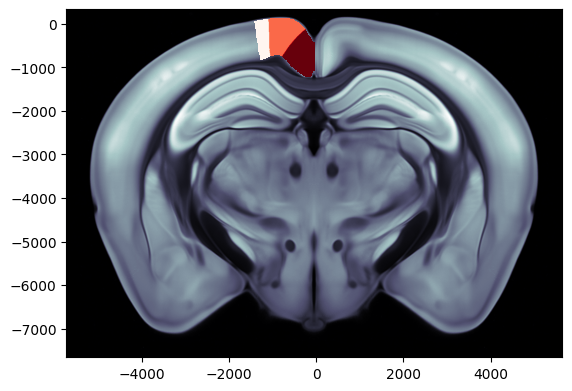
Example of plot the automerged subregions
[5]:
acronyms = np.array(['RSPagl', 'RSPd', 'RSPv'])
# `Beryl` mapping merge
ibl.plot_scalar_on_slice(acronyms, coord=-2000, plane='coronal', background='image', cmap='Reds', mapping='Beryl')
plt.show()
Plot region: ['RSPagl', 'RSPd', 'RSPv']
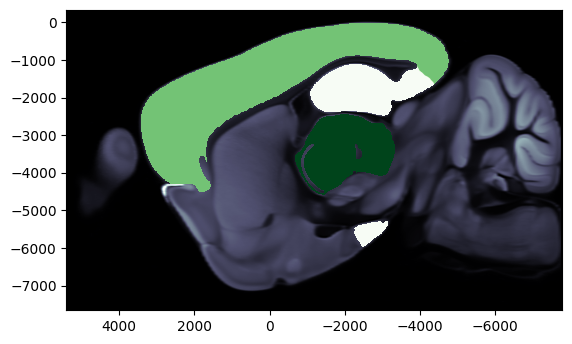
Example of plot the sagittal subregions
[6]:
acronyms = np.array(['VPM', 'VPL', 'PO', 'LP', 'CA1', 'DG-mo', 'SSs5', 'VISa5', 'AUDv6a', 'MOp5', 'FRP5'])
ibl.plot_scalar_on_slice(acronyms,
                         coord=-2000, plane='sagittal', mapping='Cosmos',
                         hemisphere='left', background='image', cmap='Greens')

plt.show()
Plot region: ['HPF', 'Isocortex', 'TH']
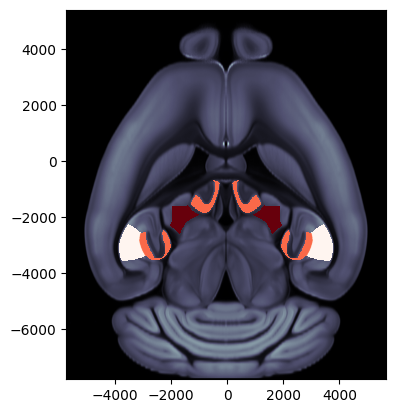
Example of plot the transverse view
[7]:
acronyms_lh = np.array(['LP', 'CA1'])
values_lh = np.random.randint(0, 10, acronyms_lh.size)
acronyms_rh = np.array(['DG-mo', 'VISa5'])
values_rh = np.random.randint(0, 10, acronyms_rh.size)
acronyms_lr, values_lr = prepare_lr_data(acronyms_lh, values_lh, acronyms_rh, values_rh)
ibl.plot_scalar_on_slice(acronyms_lr, values=values_lr, coord=-2500, plane='horizontal', mapping='Allen',
                         hemisphere='both', background='image', cmap='Reds', clevels=[0, 5])

plt.show()
Plot region: ['CA1', 'DG-mo', 'LP', 'VISa5']
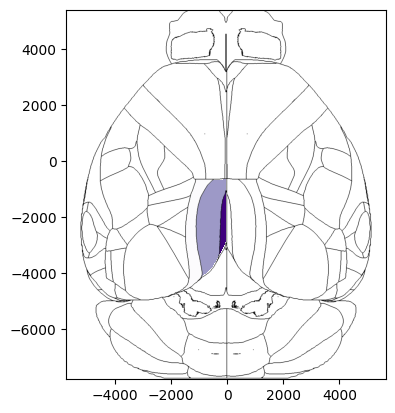
Example of plot the Top view (dorsal cortex)
[8]:
acronyms = np.array(['RSPagl', 'RSPd', 'RSPv'])
ibl.plot_scalar_on_slice(acronyms, coord=-2000, plane='top', hemisphere='left',
                         background='boundary', cmap='Purples', mapping='Beryl')

plt.show()
Plot region: ['RSPagl', 'RSPd', 'RSPv']
/opt/homebrew/Caskroom/miniconda/base/envs/rscvp/lib/python3.9/site-packages/iblatlas/atlas.py:172: RuntimeWarning: invalid value encountered in cast
  ii = np.array(np.round(i)).astype(int)